Unit pricing
View current Financial Year daily unit pricing. Prices are updated regularly.
Alternatively, view historical weekly and daily unit pricing from inception to close of prior Financial Year.
Understanding your investment risk
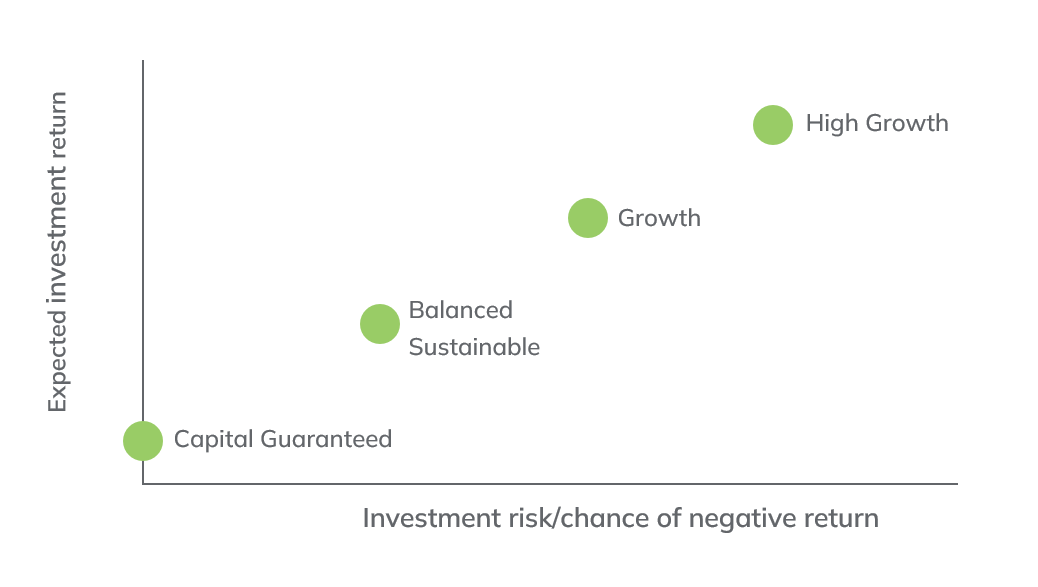
The chance of your investments rising or falling in value is related to the option you chose, and how that option invests your money. Capital Guaranteed has the lowest risk and provides security in the value of your investment. High Growth, on the other hand, has the highest risk because it has a higher weighting to growth assets such as shares and property.
Risk profile of investment options (for illustrative purposes)
Measuring your risk
Risk can be hard to interpret because it can be measured in different ways. The good news is there are ways to help you understand and quantify the level of risk you are comfortable with. A common method is the twenty-year principle. This method calculates how many years of negative yearly returns you can expect over a twenty-year period. A higher number represents higher risk because there will be more years with a negative result, and vice versa.
Likelihood of negative annual returns over 20 years
|
Investment Options |
|
|
|
|
|
Capital Guaranteed |
Sustainable |
Balanced |
Growth |
High Growth |
|
0 |
3 to 4 |
3 to 4 |
4 to 5 |
5 to 6 |
Performance | Funeral Bond Market Linked Options
|
Net Returns 30 November 2025 |
|
|
|
|
|
|
Investment Options |
Inception date |
FYTD |
1 year |
2 years p.a. |
3 years p.a. |
|
High Growth |
21 July 2021 |
4.07% |
6.26% |
9.16% |
7.73% |
|
Growth |
21 July 2021 |
3.27% |
5.37% |
6.91% |
5.69% |
|
Sustainable |
21 July 2021 |
1.22% |
2.98% |
5.89% |
4.84% |
|
Balanced |
19 July 2023 |
2.33% |
4.37% |
6.29% |
N/A |
Past performance is not a reliable indicator of future performance. The value of investments can rise or fall, and investment returns can be positive or negative. The Figures shown are net investment returns, that is, after fees, costs and taxes have been paid over the set periods of time shown and may not reflect the actual returns experienced by investors due to timing of contribution receipts.
Benchmark long-term CPI+ investment objectives:
- CPI +4% pa for High Growth;
- CPI +3% pa for Growth; and
- CPI +2% pa for Sustainable & Balanced
Capital Guaranteed Performance
Notes: The Total Return is the sum of the bonus rate allocated and the tax benefit. Past performance should not be taken as a guide to future performance.
Benchmark long-term CPI+ investment objectives:

